
2026 Australian Materials & Mining Sector: M&A Overview
By Morgan Business Sales | June 2026 | View All Industry Reports
Executive Summary
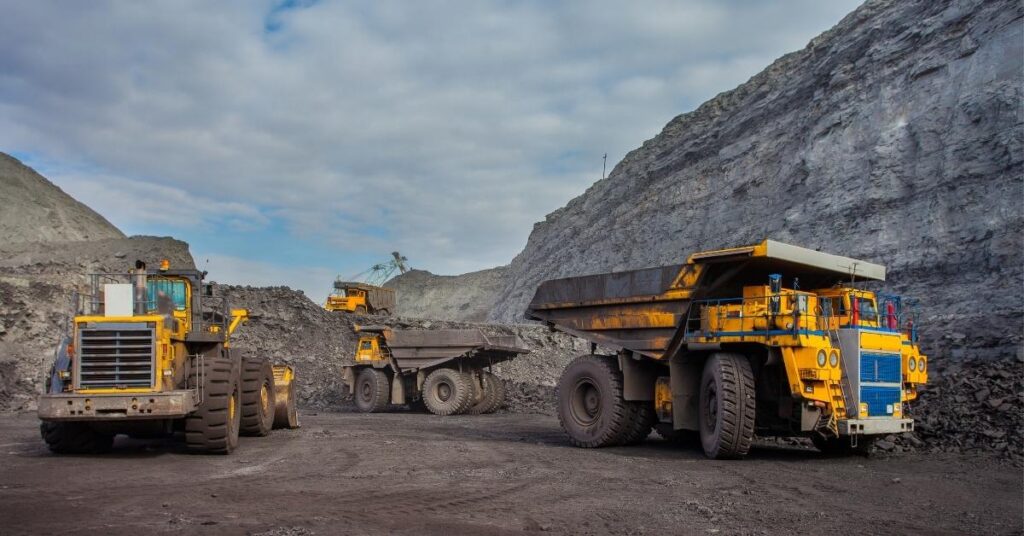
Australia's materials and mining sector is the backbone of the national economy — generating A$437.3 billion in revenue, contributing 11–12% of GDP, and accounting for approximately 70% of national export earnings. In 2026, it is also one of the world's most active M&A arenas. A gold price supercycle that took spot prices above US$5,600/oz in January 2026, systematic Chinese export restrictions on critical minerals, a recovering lithium market, record copper demand growth projections, and A$22.7 billion in federal industrial policy funding have converged to produce deal volumes not seen since the 2010–2012 supercycle. This report documents 22 verified Australian M&A transactions from 2022 to 2026, spanning gold, copper, nickel, lithium, coal, contract mining, and drilling services — with full valuation benchmarks across 12 subsegments, analysis of 7 structural demand drivers, and a complete overview of what business owners, investors, and transaction advisers need to understand about the current M&A environment in this sector.
Sector Overview: Australia's Materials & Mining Industry
Australia's materials and mining sector is, by any measure, the engine of the national economy. IBISWorld estimates total Division B (Mining) revenue at A$437.3 billion for FY2024–25 — a figure that encompasses the raw commodity value of iron ore, gold, coal, copper, lithium, and all other mineral production. The sector contributes 11–12% of GDP directly and approximately 14.3% when Mining Equipment, Technology and Services (METS) industries are included. It accounts for roughly 70% of Australia's national export earnings and directly employs 314,500 people — with total employment, including indirect supply chain roles, estimated at approximately 1.1 million Australians.
The sector's revenue profile across FY2024–25 reflects both commodity-cycle dynamics and structural shifts. Iron ore remains the dominant subsegment at A$131.5 billion in revenue, though it experienced an 18% decline on weaker prices from China's softening steel demand. Gold surged to A$37.9 billion — a 25.9% increase driven by record gold prices that broke above US$4,000/oz in October 2025. Copper ore mining reached A$10.2 billion, supported by BHP's Olympic Dam and the newly integrated OZ Minerals assets. Mining support services (contract mining) contribute A$18.3 billion. Critical minerals lithium, despite a severe price crash, remains a strategically critical export valued at approximately A$5.2 billion in FY2025 — recovering from trough and forecast to reach A$8.2 billion by FY2030. Total resources and energy export earnings are forecast at A$383 billion for FY2025–26, with gold and copper providing upside against continuing iron ore softness.
The sector spans a diverse range of business types that are all relevant to the M&A market. At the large end — listed on the ASX and globally significant — are companies like Northern Star Resources (A$6.4 billion revenue, 1,630 koz gold production), Evolution Mining (A$4.35 billion revenue), Whitehaven Coal (A$5.8 billion revenue), Fortescue Metals Group (US$15.5 billion revenue), and Perenti Global (A$3.49 billion revenue in mining services). At the mid-market level — the primary focus of this report — there are hundreds of operating mines, contract drilling businesses, mineral processing facilities, mining engineering consultancies, and specialist service providers generating between A$2 million and A$200 million in annual revenue. This mid-market segment is where the majority of actual M&A transactions occur by deal count, and where business owners have the greatest opportunity to engage a strategic or financial buyer.
Geographic concentration is pronounced. Western Australia dominates, accounting for over 50% of the national mining workforce and the majority of gold, iron ore, lithium, and nickel production. The Pilbara region houses the world's largest iron ore operations (BHP WAIO, Rio Tinto Pilbara, Fortescue) as well as critical lithium deposits (Pilgangoora, Greenbushes, Wodgina, Mt Marion). The Goldfields region, centred on Kalgoorlie, is one of the world's most prolific gold belts. Queensland's Bowen Basin hosts Australia's premier metallurgical coal operations, while the Northern Territory hosts the Nolans rare earths project and the McArthur River zinc mine. New South Wales contributes significant copper (Cobar, Northparkes), gold, and zinc production. South Australia is home to BHP's Olympic Dam — one of the world's largest copper-uranium-gold-silver deposits.
The sector's market structure is characterised by extreme concentration at the commodity level — iron ore is effectively an oligopoly of BHP, Rio Tinto, and Fortescue, while Lynas Rare Earths holds a near-monopoly on Australian rare earth production — but significant fragmentation in the services, mid-tier mining, and exploration segments. The gold sector has over 40 listed producers, with the top three (Newmont's Australian assets, Northern Star, and Evolution) holding roughly 35–40% of production. Contract mining and drilling are moderately competitive, with Perenti (A$3.49 billion revenue), NRW Holdings (A$3.3 billion), Macmahon (A$2.4–2.5 billion guidance), and Thiess (via MACA acquisition) as the dominant players. Mining engineering is highly fragmented, with Worley (A$11.24 billion globally), Monadelphous (A$2.17 billion), and GR Engineering (A$479 million) occupying different market positions.
ANZSIC Classification: Materials & Mining Subsegments
The materials and mining sector spans multiple ANZSIC 2006 (Revision 2.0) industry codes within Division B (Mining) and several adjacent divisions. The table below maps each key subsegment to its primary classification for M&A screening, industry benchmarking, and regulatory purposes.
| Subsegment | ANZSIC Code | Description |
|---|---|---|
| Coal Mining (Black / Met) | B0610 | Black Coal Mining (metallurgical and thermal) |
| Coal Mining (Thermal / Steaming) | B0620 | Other Coal Mining (thermal/steaming coal) |
| Iron Ore Mining | B0801 | Iron Ore Mining |
| Gold Ore Mining | B0802 | Gold Ore Mining |
| Copper Ore Mining | B0803 | Copper Ore Mining (incl. copper-gold) |
| Nickel Ore Mining | B0804 | Nickel Ore Mining (incl. nickel sulphide and laterite) |
| Silver, Lead & Zinc Ore Mining | B0805 | Silver, Lead and Zinc Ore Mining |
| Other Metal Ore Mining (Lithium, REE, Cobalt, Graphite) | B0899 | Other Metal Ore Mining n.e.c. — covers lithium, rare earths, cobalt, graphite, antimony, uranium, tungsten |
| Mineral Sand Mining (Titanium / Zircon) | B0900 | Mineral Sand Mining (ilmenite, rutile, zircon, monazite) |
| Mineral Exploration | B1100 | Mineral Exploration |
| Mining Support Services / Contract Mining | B1101 | Mining Support Services (contract mining, drilling, blasting, site services) |
| Other Mining Support Services (incl. exploration drilling) | B1109 | Other Mining Support Services n.e.c. |
| Mining Engineering & Environmental Consulting | M6910 | Engineering Consulting Services (not in Division B — cross-listed) |
| Mineral Processing & Beneficiation | B0800 series / C2100 | Classified under relevant mining code if integrated; Basic Non-Ferrous Metal Manufacturing (C2100) if standalone |
Verified M&A Transactions: 2022–2026
The following 22 transactions are genuine, completed or substantially progressed acquisitions and mergers involving Australian materials and mining assets from 2022 through to mid-2026. Each is a discrete M&A event — not a capital raising, JV formation without acquisition of control, or market trend. Deal values are in AUD unless stated as USD. USD figures converted at approximately AUD/USD 0.71 where a direct AUD figure is not available from source. Transaction 22 (Liontown/Albemarle) is included as a notable lapsed bid — it is the most significant failed transaction in Australian mining M&A over this period and is directly instructive for critical minerals owners.
| # | Target | Acquirer | Value (AUD) | Completed | Subsegment |
|---|---|---|---|---|---|
| 1 | OZ Minerals | BHP Group | A$9.6 billion | May 2023 | Copper / Nickel |
| 2 | Newcrest Mining | Newmont Corporation | ~A$27 billion | Nov 2023 | Gold Producers |
| 3 | Daunia & Blackwater Mines | Whitehaven Coal | ~A$4.5–5.8 billion | Apr 2024 | Metallurgical Coal |
| 4 | De Grey Mining | Northern Star Resources | A$5 billion | May 2025 | Gold Developers |
| 5 | Westgold / Karora (Merger) | Westgold Resources | A$1.37 billion | Aug 2024 | Gold Producers |
| 6 | Spartan Resources | Ramelius Resources | A$2.4 billion | Jul 2025 | Gold Producers |
| 7 | Gold Road Resources | Gold Fields (SA) | A$3.7 billion | Sep 2025 | Gold Producers |
| 8 | Western Areas | IGO Limited | A$1.1 billion | Jun 2022 | Nickel |
| 9 | Mincor Resources | Wyloo Metals (Forrest) | A$760 million | Jul 2023 | Nickel |
| 10 | Ernest Henry Mine (100%) | Evolution Mining | A$1.0 billion | Jan 2022 | Gold / Copper |
| 11 | Northparkes Cu-Au Mine (80%) | Evolution Mining | ~A$669 million | Dec 2023 | Copper / Gold |
| 12 | CSA Copper Mine (Cobar) | MAC Copper / Metals Acquisition Corp | ~A$1.41 billion | Jun 2023 | Copper |
| 13 | Round Oak Minerals | Aeris Resources | A$234 million | Jul 2022 | Copper / Zinc |
| 14 | Allkem / Livent → Arcadium Lithium (Merger) | Merger of equals | ~A$15 billion combined | Jan 2024 | Lithium |
| 15 | Arcadium Lithium | Rio Tinto | ~A$9.4 billion | Mar 2025 | Lithium |
| 16 | Bald Hill Lithium Mine | Mineral Resources (MinRes) | A$260 million | Nov 2023 | Lithium |
| 17 | Latin Resources | Pilbara Minerals | A$560 million | Feb 2025 | Lithium |
| 18 | MinRes Lithium JV (30% stake) | POSCO Holdings | ~A$1.08 billion | 2024 | Lithium |
| 19 | DDH1 Limited | Perenti Group | A$410 million | Oct 2023 | Drilling / Mining Services |
| 20 | MACA Limited | Thiess Group | ~A$347 million | Nov 2022 | Contract Mining |
| 21 | Poseidon Nickel / Horizon Minerals (Merger) | Horizon Minerals | Small-cap merger (scrip) | Feb 2025 | Nickel / Gold |
| 22 | Liontown Resources / Albemarle (lapsed) | Albemarle Corporation | A$6.6 billion (lapsed) | Oct 2023 (lapsed) | Lithium (lapsed bid) |
Transaction Commentary
BHP / OZ Minerals (A$9.6 billion, May 2023) — BHP's acquisition of OZ Minerals is a defining case study in strategic copper premium. BHP's initial bid of A$25/share was rejected; the revised A$26.50/share (a 49.3% premium to pre-bid prices) was accepted. OZ Minerals held Australia's third-largest copper operation — Prominent Hill and Carrapateena in South Australia — plus the West Musgrave nickel-copper project in Western Australia. BHP's rationale was explicit: securing long-cycle copper and nickel assets to underpin its battery metals strategy. For mid-market owners, this transaction demonstrates that globally relevant, quality copper assets in Tier-1 jurisdictions attract strategic rather than financial premiums — and that BHP was willing to pay 49% above market to secure them.
Newmont / Newcrest Mining (~A$27 billion, November 2023) — At the time of announcement, this was the largest gold mining merger in history. Newmont acquired ASX-listed Newcrest for an implied enterprise value of approximately A$28.8 billion (US$19.2 billion), gaining Tier-1 assets at Cadia (NSW), Lihir (PNG), Telfer (WA), and Red Chris (Canada). The deal added approximately 750,000 oz/year of gold production and 50 billion pounds of copper resources. Projected synergies of US$500 million per year pre-tax were guided within 24 months of close. Newcrest shareholders received Newmont CDIs, retaining exposure to one of the world's leading gold portfolios. The scale of this transaction — and the subsequent deal wave it triggered — reflects how Australia's Tier-1 jurisdiction, political stability, and established operating infrastructure position domestic gold assets at the very top of global acquirer wish-lists.
Whitehaven Coal / Daunia & Blackwater (A$4.5–5.8 billion, April 2024) — Whitehaven acquired the two BHP Mitsubishi Alliance (BMA) coking coal mines in Queensland's Bowen Basin for aggregate consideration of US$3.2 billion fixed, plus a price-linked earn-out of up to US$900 million (total up to US$4.1 billion / A$5.8 billion). This transformed Whitehaven from a predominantly thermal coal producer (94% thermal in FY2023) into Australia's leading ASX-listed metallurgical coal producer, with pro-forma ROM production of ~40 Mtpa and approximately 70% met coal exposure. The acquisition multiple of 1.8x EV/FY2024F EBITDA was considered highly attractive at spot coal prices. The deferred and earn-out payment structure — US$1.1 billion deferred over three years plus price-linked earn-out — enabled Whitehaven to limit upfront capital risk while still securing transformational assets from a motivated seller rationalising its portfolio.
Northern Star Resources / De Grey Mining (A$5 billion, May 2025) — Northern Star's all-scrip acquisition of De Grey Mining was the biggest domestic Australian gold deal of 2025 and one of the most strategically significant in the country's mining history. De Grey held the Hemi gold project in the Pilbara — a world-class orogenic gold system with a ~9.4 Moz resource base, projected to produce over 530,000 oz/year from 2027 at an estimated AISC of A$1,200–1,400/oz over a 20-year-plus mine life. The 37.1% premium to De Grey's last closing price implied a resource valuation of approximately A$290/oz — materially above the typical A$50–150/oz range for ASX gold developers, reflecting the exceptional Tier-1 WA jurisdiction and scale. De Grey delisted from ASX on 6 May 2025. For mid-market owners, this transaction establishes that in the current gold price environment, quality and jurisdiction certainty command developer premiums far above historical benchmarks.
Westgold / Karora Resources (A$1.37 billion, August 2024) — A textbook mid-tier gold consolidation. Westgold Resources merged with Canadian-listed Karora Resources (owner of Beta Hunt and Higginsville gold operations in WA) to create a top-5 Australian gold producer with a pro-forma market capitalisation of A$2.2 billion and annual production capacity of 400,000–450,000 oz/year. Estimated synergies of A$490 million (including capital expenditure optimisation) were projected. Notably, Ramelius Resources had earlier attempted to acquire both Karora and then Westgold — the competitive dynamics ultimately benefited Westgold shareholders and validated Beta Hunt's high-grade value. For owners of mid-tier WA gold operations, the transaction illustrates that combining complementary operations to achieve scale sufficient for ASX200 index inclusion is a value-creating strategy that well-capitalised buyers will pay for.
Ramelius Resources / Spartan Resources (A$2.4 billion, July 2025) — Ramelius had held a 19.9% strategic stake in Spartan Resources before launching its A$2.4 billion takeover bid in March 2025, which received approximately 90.3% shareholder approval. Spartan's Dalgaranga project in the Murchison was transformed by the 2024 discovery of the high-grade Never Never ore body, rapidly upgrading its economics from a modest project to a A$2.4 billion acquisition target. The combined group targets over 500,000 oz/year of gold production by FY2030, with A$500 million-plus net cash and a 12.1 Moz combined resource. This case is instructive on two fronts: the value of early minority stake positions as an acquisition pathway, and the extraordinary leverage that a major exploration discovery provides for a development-stage asset — in this case, compressing the journey from a ~A$500 million project to a A$2.4 billion takeover target within approximately 18 months of the Never Never discovery announcement.
Gold Fields / Gold Road Resources (A$3.7 billion, September 2025) — Gold Fields, the South African miner and existing 50% JV partner in the Gruyere gold mine in WA, acquired the remaining 50% held by ASX-listed Gold Road Resources for A$3.40 per share (a 43% premium to Gold Road's undisturbed closing price of A$2.38). Gold Road's board successfully rejected two prior underbids before Gold Fields declared a best and final offer. The 2025 gold price environment (~US$3,000/oz at announcement) materially elevated seller leverage, and Gold Road extracted full value. This was the third major ASX 200 gold M&A transaction of 2025, following Northern Star/De Grey and Ramelius/Spartan — a concentration of large-cap gold deals that reflects the extraordinary free cash flow generation at senior producers and their urgency to replenish reserve bases at scale.
IGO / Western Areas (A$1.1 billion, June 2022) — IGO's acquisition of nickel sulphide producer Western Areas came at the peak of nickel's battery metals narrative, when IGO was explicitly building a battery metals portfolio alongside its 49% stake in the Greenbushes lithium spodumene operation (via TLEA). The deal tripled IGO's nickel production from approximately 12,000 t to ~40,000 t/year pro-forma, with the Odysseus (Cosmos) mine — a 10-year-plus underground operation — as the strategic prize. The transaction was funded via A$900 million senior-secured debt, possible at historically low interest rates at the time. The subsequent nickel price collapse (driven by Indonesian supply flooding) and BHP's suspension of Nickel West are a salutary lesson in commodity cycle risk — but also validate that quality WA nickel sulphide assets remain strategically important for the eventual cycle recovery.
Wyloo Metals / Mincor Resources (A$760 million, July 2023) — Wyloo Metals, Andrew Forrest's private mining vehicle, launched an on-market takeover of nickel sulphide producer Mincor Resources at A$1.40/share — a 35% premium — and completed compulsory acquisition in July 2023 after exceeding the 90% ownership threshold. Wyloo's strategic rationale was supply chain integration: Mincor's Kambalda production was intended to feed a planned downstream battery materials facility (PCAM — precursor cathode active material) at Kwinana, co-developed with IGO. This transaction illustrates that private, strategically motivated buyers — not constrained by listed company cost-of-capital metrics — can pay material premiums when their acquisition thesis is driven by downstream value creation rather than near-term earnings accretion.
Evolution Mining / Ernest Henry Mine (A$1.0 billion, January 2022) and Northparkes Mine (A$669 million, December 2023) — Evolution's two copper-gold acquisitions in this period illustrate a deliberate portfolio strategy: transforming from a predominantly gold company into a significant copper producer. Ernest Henry, acquired from Glencore in a structured A$800 million upfront plus A$200 million deferred payment, converted Evolution's prior economic interest into full operatorship and materially increased copper earnings through by-product credits. Northparkes — acquired from CMOC (China Molybdenum) for US$475 million — is a well-established block-cave copper-gold mine in NSW providing immediate cash flow. Both deals were fully funded at announcement, with no conditions precedent on Northparkes enabling speed of execution that gave Evolution a competitive advantage over other potential buyers. Together, they demonstrate how a disciplined acquirer can build a diversified copper-gold portfolio through sequential, operationally manageable acquisitions.
MAC Copper / CSA Mine (Cobar) (~A$1.41 billion, June 2023) — A unique transaction in which Metals Acquisition Corp (a US-listed SPAC) acquired Glencore's CSA copper mine in Cobar NSW for total base consideration of approximately US$1.0 billion. The SPAC structure — funded via trust proceeds and a US$230 million PIPE — allowed MAC to acquire a high-value, producing, Tier-1 jurisdiction asset without an existing revenue base. Glencore retained a 20.6% equity stake and 100% life-of-mine copper concentrate offtake, structuring the deal economics to make MAC's financing workable. For mid-market business owners, this transaction demonstrates that alternative capital structures — SPACs, cornerstone strategic investors, deferred and contingent payments — can unlock acquisitions that traditional trade buyers might not pursue.
Rio Tinto / Arcadium Lithium (~A$9.4 billion, March 2025) — Rio Tinto's acquisition of Arcadium Lithium — itself formed in January 2024 from the merger of Australian company Allkem and US-listed Livent — at a 90% premium to Arcadium's undisturbed share price is the defining counter-cyclical mining M&A transaction of this era. At the time of announcement (October 2024), lithium carbonate prices were approximately 80% below their 2022 peak, most lithium developers were trading at severe discounts, and conventional wisdom held that buying lithium at cycle trough was high risk. Rio paid US$6.7 billion (~A$9.4 billion) because it was acquiring a fully integrated, vertically diversified lithium portfolio across WA, Argentina, Canada, and Japan — providing a path to 250,000 t/year of lithium chemicals capacity by 2028 to supply EV manufacturers directly. This transaction established that for assets of sufficient scale and strategic importance, global majors will pay through-cycle valuations regardless of current commodity pricing.
Perenti Group / DDH1 Limited (A$410 million, October 2023) and Thiess / MACA Limited (~A$347 million, November 2022) — Both transactions reflect the ongoing consolidation logic in Australian contract mining and drilling services. Perenti acquired DDH1 — Australia's largest exploration and resource definition drilling contractor (four brands, 190+ rigs, ~A$350 million revenue) — in a cash-and-scrip deal that created the ASX's leading diversified contract mining services group with a combined fleet of 290+ rigs. Thiess, owned 50/50 by CIMIC and Elliott Management and Australia's largest contract miner, acquired mid-tier construction and contract mining company MACA at a 42–49% premium over undisturbed VWAP — with NRW Holdings as a competing bidder. The competitive tension between Thiess and NRW validated MACA's premium valuation and underscored that quality mid-tier contract miners with established WA and QLD footprints attract multiple strategic buyers. For owners of mining services businesses, these transactions establish EV/EBITDA benchmarks of 5–8x and confirm that management quality, fleet condition, and backlog visibility are the primary value drivers.
Liontown Resources / Albemarle (A$6.6 billion, lapsed October 2023) — The most significant lapsed deal in Australian mining M&A over this period is directly instructive for critical minerals owners. Albemarle Corporation — the world's largest lithium producer — made four escalating approaches to Liontown Resources (developer of the Kathleen Valley lithium project in WA) before reaching a board-intended recommendation at A$3.00/share (total equity value A$6.6 billion). In October 2023, Albemarle withdrew citing "growing complexities" — primarily the fact that Hancock Prospecting (Gina Rinehart's private vehicle) had built its stake in Liontown to 19.9%, sufficient to block a scheme of arrangement requiring 75% shareholder approval. The FIRB also blocked at least one earlier foreign approach to Bald Hill Lithium before MinRes prevailed. These cases illustrate that strategic blocking stakes and foreign investment screening are real and material risks in critical minerals M&A — and that well-capitalised Australian buyers with established FIRB relationships hold a structural advantage over offshore bidders in competitive situations.
Valuation Benchmarks by Subsegment
The following table presents indicative valuation multiples across the major subsegments of the Australian materials and mining sector. All figures reflect mid-2026 conditions — taking into account disclosed transaction data, ASX-listed company trading multiples, and analyst research. Individual transactions will deviate materially based on asset quality, cycle timing, strategic fit, and negotiating dynamics. These ranges are intended as a starting point for M&A price expectation-setting, not as a guarantee or floor.
| Subsegment | Primary Metric | Typical Range | Key Notes |
|---|---|---|---|
| Gold Producers (operating mines) | EV/EBITDA | 6–10x | Mid-cycle normalised; EV/oz Reserve A$200–400/oz. P/NAV 0.8–1.3x. Despite gold at record highs, multiples remain near 5-year lows due to earnings multiple compression as analyst price decks lag spot. |
| Gold Developers (advanced, Tier-1) | EV/oz Resource | A$50–150/oz typical; A$290+/oz (infra-adjacent) | Infrastructure-adjacent deals have reset the benchmark. NST/De Grey implied ~A$290/oz on Hemi resources. P/NAV ~0.3–0.7x trading; ~1.0x at acquisition. 30–70%+ premium-to-NAV at transaction. |
| Iron Ore Producers (mid-tier) | EV/EBITDA | 4–6x | Fortescue (benchmark): ~5.4x EV/EBITDA at mid-2026. EV/tonne Reserves A$2–5/t. Chinese steel demand uncertainty and price pressure keep multiples compressed vs peak cycle. |
| Copper Producers (operating) | EV/EBITDA | 5–8x | Strategic scarcity premium applies; Tier-1 assets above range. EV/lb Cu Reserves US$0.20–0.40/lb. BHP/OZ Minerals implied ~US$0.35/lb on copper R&R. 14-year avg mine development timeline makes acquisitions preferred. |
| Nickel Producers (WA sulphide) | EV/EBITDA | 2–4x (trough) | Deeply depressed by Indonesian supply overhang. BHP US$2.5B impairment on Nickel West. P/NAV 0.3–0.6x. Operating assets valued on optionality/care-and-maintenance basis; counter-cyclical buyers emerging. |
| Metallurgical Coal Producers | EV/EBITDA | 3.5–5.5x | HCC benchmark ~US$196/t (FY25). EV/t Reserve A$15–40/t (HCC). P/NAV 0.6–1.0x. Whitehaven's BMA acquisition implied 1.8x EV/forward EBITDA at spot. Deferred and earn-out structures common. |
| Thermal Coal Producers | EV/EBITDA | 2.5–4.0x | ESG constraints structurally limit buyer pool. Major banks increasingly declining coal financing. Thermal coal increasingly un-financeable by institutional lenders. Valuations reflect buyer pool depth, not just cash flows. |
| Lithium Producers/Developers (operating, through-cycle) | EV/EBITDA | 6–12x (through-cycle) | EV/t LCE Resource A$30–80/t in current downcycle (peak was A$150–300/t). Rio/Arcadium at 90% premium = counter-cyclical benchmark. Lithium M&A fell 89% in 2025 to just 4 qualifying deals, creating pent-up pipeline for 2026–27. |
| Rare Earths (Lynas benchmark) | EV/EBITDA | 40–45x | Lynas: EV/EBITDA 41x; EV/Revenue 18x (Jun 2026). Only ex-China dysprosium/terbium producer. China Apr 2025 export controls on 7 heavy REEs have materially increased strategic premium. Developer values primarily narrative/strategic. |
| Mineral Sands (Titanium / Zircon) | EV/EBITDA | 5–12x (7–20x with RE optionality) | Iluka: EV/EBITDA 19.7x (LTM, Jun 2026) — elevated by Eneabba rare earth refinery optionality. Historical 7–14x for mineral sands only. EV/t HM In-Situ A$2–10/t depending on grade and assemblage. |
| Specialty Metals (Antimony / Tungsten) | Strategic premium | 50–200%+ (strategic scarcity) | China export controls on antimony (Aug 2024) caused 97% drop in US imports; prices roughly doubled. Limited ASX producers; values driven by strategic buyer premium (defence, semiconductors). EV/EBITDA 4–10x if operating. |
| Mineral Processing / Beneficiation Facilities | EV/EBITDA | 5–10x | Take-or-pay / tolling contract facilities: 8–10x. Single-customer: 5–7x. CMPTI adds ~A$101M NPV per A$150M annual eligible spend (10yr, 8% discount). Critical minerals processing facilities eligible from 2027. |
| Contract Mining Services | EV/EBITDA | 3.5–6x | Perenti (ASX benchmark): EV/EBITDA 3.6x; EV/Revenue 0.7x (Jun 2026). Backlog/EV 4–8x as quality indicator. MACA acquired at 42% premium over undisturbed VWAP — confirms mid-tier contract miners attract multiple strategic buyers. |
| Mining Engineering / Environmental Consulting | EV/EBITDA | 7–12x | EV/Revenue 0.8–1.8x. Small firms (A$1–3M EBITDA): 6.1–6.7x. Mid-market mining specialists (A$3–10M EBITDA): 7–9x. Large integrated (A$10M+): 9–12x. Environmental approvals expertise and First Nations capability command premium. |
Demand Drivers: What Is Accelerating M&A Activity
Seven structural forces are converging in 2026 to produce the most active Australian mining M&A environment since the 2010–2012 supercycle. Each is detailed below with supporting data.
1. Gold at Record Highs — The Engine of Australian Mining M&A
Gold has undergone a historic repricing that has fundamentally altered the economics of Australian gold mining. Gold entered 2024 at approximately US$2,000/oz, broke decisively above US$3,000/oz in spring 2025, accelerated to above US$4,000/oz in October 2025, and reached an intraday record high of US$5,608/oz in January 2026. As of June 2026, gold trades near US$4,495/oz — approximately 33% higher year-on-year even after partial retracement. J.P. Morgan forecasts gold to average US$5,055/oz in Q4 2026, with Societe Generale targeting US$6,000/oz by year-end. The World Gold Council's base case frames US$4,000/oz as a support floor, not a ceiling.
The price drivers include: central bank gold purchases averaging approximately 190 tonnes per quarter, ETF inflows (including a record US$109 billion of quarterly demand at average Q3 2025 prices of US$3,458/oz), persistent US dollar weakness, and structural de-dollarisation by emerging market central banks. With AISC for Australian producers averaging approximately AU$1,700/oz against realised prices of AU$5,500–6,000/oz, AISC margins have approximately doubled from pre-2023 peaks.
Despite gold at nominal all-time highs, EV/EBITDA multiples for gold equities remain near five-year lows due to an unusual compression dynamic: analyst consensus long-term price decks remain well below spot (~US$2,300/oz vs US$3,500+ spot), so rising share prices are largely offset by rising earnings estimates rather than producing multiple expansion. This creates a material M&A timing consideration — buyers using consensus-based NAV undervalue targets, while sellers who can demonstrate spot-price NAV upside can command significant premiums over market price.
The M&A impact is direct. The global mining sector in 2025 recorded its strongest year since the 2010–2012 supercycle, with 180 transactions totalling US$89 billion. Precious metals M&A reached US$31 billion across 84 transactions — a 42% volume surge year-on-year. Capital raising by precious metals miners hit US$14.5 billion in 2025, compared with just US$4.6 billion in 2024. Four major Australian gold M&A completions occurred in 2025 alone (Northern Star/De Grey, Ramelius/Spartan, Gold Fields/Gold Road, Westgold/Karora), and analysts are predicting a second wave of mid-tier consolidation into 2026 and beyond as cash-flush senior producers continue to run out of organic reserve replacement options.
2. Critical Minerals Geopolitics — Structurally Rewiring Supply Chains
China controls approximately 69% of global rare earth production and holds dominant positions across the critical minerals supply chain. From 2023 through 2025, China deployed an escalating series of export controls as a strategic instrument in the broader US-China technology and trade contest. The sequence includes: export licences required for gallium and germanium (July 2023); controls on synthetic and natural flake graphite (October 2023); export licences for antimony effective September 2024 — causing Chinese antimony shipments to the US to fall 97% in the four months to December 2024, with prices roughly doubling; an outright ban on gallium, germanium and antimony exports to the US (December 2024); licences for tungsten, tellurium, bismuth, indium and molybdenum (February 2025); and export licences for seven medium and heavy rare earths including dysprosium and terbium — critical for EV motors and wind turbines — in April 2025.
Each escalation directly increases the strategic premium on non-Chinese sources. Australian assets carrying these commodities — antimony at Mandalay Resources' Costerfield mine in Victoria (Australia's only operating antimony mine), gallium and germanium as co-products from zinc operations, rare earths at Lynas (Mt Weld/Kalgoorlie), graphite from exploration-stage projects — have attracted bilateral government support and private capital precisely because China's actions validate the supply chain diversification thesis.
On 20 October 2025, President Trump and Australian Prime Minister Albanese signed the United States-Australia Framework for Securing of Supply in the Mining and Processing of Critical Minerals and Rare Earths. This landmark bilateral deal commits a minimum of US$1 billion in immediate financing to projects in both countries, with US EXIM Bank letters of interest totalling US$2.2 billion across seven Australian projects. The combined public commitments exceed US$3 billion, with a pipeline of projects valued at US$53 billion. A US-Australia Critical Minerals Supply Security Response Group was established under the US Secretary of Energy and the Australian Minister for Resources. Australia's A$1.2 billion Critical Minerals Strategic Reserve — managed by Export Finance Australia as of April 2026 — specifically supports domestic producers of antimony, gallium, and rare earths.
Australia holds a commanding position globally: it is the world's number-one lithium producer (49% of global production), number-one ilmenite producer, number-two copper resources, number-three rare earths resources (moved from sixth), and holds commercially viable deposits of 21 of the Commonwealth's 31 declared critical minerals. Economic inventories grew strongly in 2024 — lithium up 20%, graphite up 27%, rare earths up 10%, platinum group elements up 30%.
3. Lithium Market Dynamics — Crash, Trough, and Contested Recovery
The lithium market experienced one of the most severe commodity price collapses in recent history before beginning a recovery that is now directly shaping M&A activity. Lithium carbonate peaked at approximately US$80,000/tonne in late 2022; spodumene concentrate (SC6) peaked above US$7,000/t. By January 2024, spodumene had fallen to US$875/t — a 59.3% decline in three months alone. Lithium carbonate troughed near US$7,700/t in June 2025, approximately 90% below the 2022 peak. The crash caused widespread project suspensions: Core Lithium halted mining at Grants (January 2024), citing an 85% decline in spodumene prices; Liontown commenced production at Kathleen Valley but immediately faced severe margin compression; BHP and MinRes curtailed approximately 100,000 t of supply from Greenbushes; and five WA nickel mines closed amid related battery metals sentiment.
The recovery is now underway. Lithium carbonate prices in China rose from their trough to over CNY 200,500/t by May 2026 — a 191% increase year-on-year — before settling back to approximately CNY 175,750/t by June 2026. CATL's suspension of operations at its Jianxiawo mine in H2 2025 and Australian production curtailments created genuine supply tightness. J.P. Morgan and Deutsche Bank upgraded their price targets to US$18,000/t lithium carbonate for 2026 and US$25,000/t for 2027. Morgan Stanley projects an 80,000 mt LCE deficit in 2026, with larger deficits in 2027–2029 as EV demand and battery storage growth outpaces constrained supply. A significant new demand driver has emerged: energy storage systems (ESS) now represent 18% of lithium demand (up from 9% three years prior), with data centres, grid stabilisation, and solar firming driving rapid incremental growth. Global BESS deployments grew 53% year-on-year in H1 2026.
For M&A, the lithium cycle creates a classic counter-cyclical opportunity. Assets unprofitable at US$8,000/t become highly attractive at US$18,000–25,000/t. Distressed developers — carrying heavy debt from construction financing, constrained balance sheets, and suspended projects — are acquisition targets for well-capitalised strategic players, Korean and Japanese battery manufacturers, and sovereign wealth funds. Global lithium M&A value fell 89% in 2025 to just US$1.06 billion across four qualifying deals as buyers awaited clarity on price recovery — creating a significant pent-up acquisition pipeline for 2026–2027, with the fragmented ASX junior lithium sector the primary hunting ground.
4. Energy Transition Metals — The Structural Supercycle
Copper faces the most structurally significant demand-supply imbalance of any base metal. Global copper demand is projected to grow 24% by 2035, from approximately 35 Mtpa today to 42.7 Mtpa (Wood Mackenzie). S&P Global's analysis projects a supply shortfall of up to 9.9 million tonnes by 2035. EV copper demand alone is projected to reach 2.6 Mt by 2035 — a 555% increase from 396,000 t in 2023. Grid battery storage copper demand is forecast to surge 557% over the same period. The average timeline to open a new copper mine now exceeds 14 years, making acquisition the only practical path to near-term reserve replacement. Copper hit an all-time high of US$5.24/lb (US$11,552/t) on 26 March 2025, and base metals M&A reached a 14-year high of US$45.7 billion in 2025.
Australian nickel has suffered the most acute price-driven crisis of any sector in recent memory. Nickel prices collapsed approximately 51% from their 2022 peak (above US$35,000/t) to ~US$15,000–16,000/t by mid-2024, driven almost entirely by Indonesian supply flooding the market — Indonesia increased output from 345,000 tonnes (2017) to 1.8 million tonnes (2023), accounting for roughly 49% of global production. Five Western Australian nickel mines announced closures in 2023–2024. BHP suspended Nickel West operations until at least 2027, recording a AU$4.4 billion investment write-down. WA nickel employment fell by over 3,200 FTE positions. The nickel crisis has created distressed assets at steep discounts, setting the stage for counter-cyclical acquisitions when the price recovers. BHP's commitment of A$450 million per year to maintain Nickel West for potential restart signals confidence in the medium-term outlook.
The rare earth metals market, valued at approximately US$193 billion in 2024, is projected to grow to US$337 billion by 2034 at a CAGR of 8.3%. Each battery electric vehicle uses 1–3 kg of rare earth permanent magnets; dysprosium and terbium are heavy rare earths critical for high-temperature performance in EV traction motors. China controls 92% of global rare earth magnet production. Australia was the world's fourth-largest rare earth producer in 2024, with Lynas Rare Earths as the only commercially operating producer and processor of rare earth elements outside China — including the first production of commercial dysprosium oxide outside China in May 2025.
5. Consolidation Pressure on Juniors — The Structural Squeeze
Junior and mid-tier Australian miners face a structural squeeze from two directions simultaneously: cost inflation eroding margins and a capital markets drought limiting access to growth funding. Western Australia's mining employment hit a record 135,693 on-site FTE positions in 2024, with vacancies surpassing peaks from the 2011–12 mining boom. The Australian mining industry will require an additional 56,000 workers by 2033 on top of existing vacancies. Labour costs, energy costs, reagent and consumables costs, and infrastructure costs have all risen materially above CPI since 2021, compressing margins for projects operating on fixed offtake pricing or contracts structured in lower-cost periods.
On the capital markets side, the funding environment has deteriorated structurally for junior miners. Mining new issues on TSX-V were down 24% in H1 2025 (19 new issues versus 25 in H1 2024), well below the 10-year average. The number of mining companies listed on AIM hit a 20-year low with just 96 companies. On the TSX-V, the total mining company count reached its lowest level in at least 13 years at 907 businesses. The broader ASX IPO market recorded just 27 IPOs in 2024 — the lowest in a decade. The asymmetry between cash-flush senior gold miners and cash-constrained battery metals juniors is creating a classic buyer's market: senior producers with extraordinary free cash flow at US$4,000–5,000/oz gold are choosing to make strategic acquisitions of earlier-stage companies with quality resources, rather than paying the cost and timeline premium of greenfield development. Middle Eastern and Asian capital, including sovereign wealth funds, is also entering Australian mining projects at increasing scale.
6. Future Made in Australia — A$22.7 Billion Industrial Policy
In the 2024–25 Budget, the Australian Government committed A$22.7 billion over 10 years under the Future Made in Australia (FMIA) framework — a direct policy response to the US Inflation Reduction Act and the EU Net-Zero Industry Act. The flagship mining measure is the Critical Minerals Production Tax Incentive (CMPTI), which received Royal Assent on 14 February 2025 and is now law.
The CMPTI provides a 10% refundable tax offset on eligible processing and refining costs for Australia's 31 critical minerals — including lithium, cobalt, nickel, rare earths, antimony, vanadium, graphite, and manganese. It is available from 1 July 2027 to 30 June 2040 (up to 10 years per eligible facility), is uncapped in amount per project, and has an estimated budget cost of A$7 billion over the medium term. The incentive applies to processing and refining activities that chemically transform feedstock — not to upstream mining, beneficiation, capital expenditure, or raw material costs. This creates a specific incentive for downstream value-adding steps (converting spodumene concentrate to lithium hydroxide; processing rare earth concentrate to separated oxides) and for M&A activity around integrated mining-plus-processing operations.
For a processing facility incurring A$150 million of eligible expenditure annually, the CMPTI generates A$15 million per year in tax benefit — with a 10-year net present value of approximately A$101 million at an 8% discount rate. For a large lithium hydroxide facility incurring A$500 million of eligible expenditure, the annual benefit is A$50 million (10-year NPV approximately A$336 million). These figures are material additions to project economics that must be modelled in any M&A valuation for eligible processors. Foreign investors evaluating Australian critical minerals assets must incorporate CMPTI into their DCF models — it is equivalent to a structural improvement in project IRR of 2–5 percentage points for processing-heavy operations.
Complementary measures include: Export Finance Australia's A$5 billion Critical Minerals Facility; the A$1.2 billion Critical Minerals Strategic Reserve (operational April 2026, managed by EFA); the Northern Australia Infrastructure Facility (NAIF) with A$7 billion total capacity and a A$500 million earmark for critical minerals; and state-level measures including the NSW A$250 million royalty deferral scheme (live July 2025), the Queensland A$245 million Critical Minerals Strategy, and the WA Nickel Financial Assistance Program. Through 17 critical minerals strategies since 2019, Australian governments have dedicated A$6.6 billion for critical mineral developments.
7. Mining Services Consolidation — Scale, Labour, and PE Capital
The Australian mining support services sector is valued at approximately A$14.4 billion in 2025, employing approximately 38,000 people directly. Coal mining accounts for 32% of sector revenue, with other mining (gold, lithium, iron ore) at 42% and iron ore at 18%. The sector is fragmented, with NRW Holdings holding just under 10% market share. IBISWorld predicts modest growth of 1.5% over the next five years following a recent decline — a flat growth environment that is the classic precursor for consolidation where organic growth is constrained.
Major miners have increasingly outsourced mining operations to contractors to manage labour risk, operational complexity, and capital allocation. Rio Tinto cut approximately 500 Pilbara workforce positions and outsourced roles to contractors as part of ongoing cost restructuring. New critical minerals mines, which tend to be smaller and more capital-constrained, disproportionately rely on contract mining for initial operations. Leading contractors by order book include NRW Holdings (A$25.6 billion pipeline), Perenti (A$6.5 billion work in hand), and Macmahon Holdings (A$5 billion order book). Labour shortages are the defining operational constraint — the mining industry will require 56,000 additional workers by 2033 — creating M&A logic around acquiring contractors with established workforces, training pipelines, and safety credentials, particularly in underground mining where specialist skills are acutely scarce.
Private equity-backed consolidation is the defining structural trend in mining services. NRW Holdings has expanded through intelligent acquisition of competitors, securing long-term contracts while building pipeline to A$25.6 billion. The Axis Mineral Services / Raubex Group transaction exemplifies a recurring pattern: an international acquirer (South African-listed Raubex) acquires a 67% stake in an Australian contract crushing business, using structured earnouts to keep management engaged. International PE and listed companies from South Africa, Canada, and the UK are increasingly targeting Australian mining services businesses as platforms for scale, drawn by annuity-style maintenance revenue and the visibility provided by multi-year mine contracts. Mining companies are also "increasingly investing in technology firms specialising in AI for mineral exploration, automation of haulage, and innovative ore-processing techniques" — a specific category of M&A that is accelerating as decarbonisation mandates drive demand for electric and hydrogen mining equipment and specialist OEM partnerships.
Key Operators by Subsegment
The following table provides a reference overview of the primary market participants across key Australian mining subsegments as at FY2025. This is not an exhaustive list — the sector includes hundreds of mid-tier operators and service providers in the A$2 million to A$200 million revenue range that are the primary M&A targets and the audience for this report.
| Subsegment | Key Operators (FY2025) | Revenue / Scale Note |
|---|---|---|
| Gold Producers | Northern Star Resources (ASX: NST), Evolution Mining (EVN), Ramelius Resources (RMS), Westgold Resources (WGX), Regis Resources (RRL), Red 5 (RED), Perseus Mining (PRU) | NST: A$6.4B revenue, 1,630 koz; EVN: A$4.35B (record), NPAT +119%; Regis: A$1.66B, debt-free |
| Iron Ore | BHP (WAIO), Rio Tinto (Pilbara Operations), Fortescue Metals Group (FMG), Mineral Resources (MIN, Onslow Iron ramp-up) | BHP WAIO: record 290 Mt; FMG: record 198.4 Mt shipped, revenue US$15.5B (–15%); Fortescue EBITDA US$7.9B |
| Copper / Base Metals | BHP (Olympic Dam / OZ Minerals integrated), MAC Copper (CSA Cobar), Aeris Resources (Tritton/Cracow), 29Metals (Golden Grove) | BHP group record copper >2 Mt; Aeris EBITDA A$160.5M, copper 24.9kt; 29Metals restarted Golden Grove (WA) |
| Coal | Whitehaven Coal (WHC), Yancoal Australia (YAL), New Hope Corporation (NHC), Glencore (Australian operations), Coronado Global Resources (CRN) | Whitehaven: A$5.8B revenue, record 39.1 Mt ROM; Yancoal: record 38.6 Mt attributable production |
| Lithium / Critical Minerals | Pilbara Minerals (PLS), IGO Limited (IGO), Liontown Resources (LTR), Core Lithium (CXO), Mineral Resources (MIN — Wodgina/Mt Marion JVs) | Pilbara: A$769M revenue (–39%), 754,600t spodumene; IGO: A$516M; Core Lithium: restarting Finniss late 2025 |
| Rare Earths | Lynas Rare Earths (LYC), Iluka Resources (ILU — Eneabba refinery under construction), Arafura Rare Earths (ARU — Nolans project, NT) | Lynas: A$556.5M revenue (+20%); first outside-China dysprosium oxide producer (May 2025); Iluka: A$1.02B revenue |
| Mineral Sands | Iluka Resources (ILU), Sheffield Resources (SFX — Thunderbird, WA), Image Resources (IMA — transitioning to Atlas) | Iluka: A$1.02B revenue; Sheffield: 741,826t concentrate (first full year); Australia holds 66% of world rutile resources |
| Contract Mining / Drilling | Perenti Global (PRN), NRW Holdings (NWH), Macmahon Holdings (MAH), Thiess (CIMIC — post-MACA acquisition), Emeco Holdings (EHL) | Perenti: A$3.49B (record); NRW: A$3.3B (+12.2%); Macmahon: A$2.4–2.5B guidance; Emeco: A$791M |
| Mining Engineering / EPCM | Worley (WOR), Monadelphous Group (MND), GR Engineering Services (GNG), Lycopodium, DRA Global | Worley: A$11.24B globally (45,500 employees); Monadelphous: A$2.17B (+35% NPAT); GR Engineering: A$479M |
What Drives Value in a Mining Business Sale
Owners of mining operations, contract mining companies, drilling services businesses, mineral processing facilities, and mining engineering consultancies frequently underestimate the range of factors that determine their business's value in a transaction. The following analysis draws on the transaction benchmarks above and the current M&A environment to identify the most critical value drivers across the sector.
Jurisdiction and Tenure Security
Australia commands a 20–30% premium over equivalent assets in higher-risk jurisdictions (parts of Africa, Southeast Asia, and parts of Latin America) for a consistent set of reasons: political stability and no risk of nationalisation or expropriation; secure mining tenure under state Mining Resources and Sustainable Development Acts; an established, predictable environmental approvals process (EPBC/state equivalents, typically 3–7 years); a skilled FIFO workforce; existing Tier-1 infrastructure (Pilbara rail/port networks, Hunter Valley coal chain, WA Goldfields road and power networks); a common law legal system with enforceable contracts; and a competitive royalty and tax regime. For any acquirer evaluating a comparable Australian asset against one in a less predictable jurisdiction, this premium is quantifiable and consistently applied in deal pricing.
Infrastructure Proximity
Within Australia, infrastructure-proximate assets command a structural premium over remote or stranded assets. For gold developers, access to an existing mill or processing hub can add A$100–300/oz premium over equivalent undeveloped resource ounces without mill access — as established by recent Agnico Eagle and G Mining Ventures benchmark acquisitions. For iron ore, Pilbara assets without access to existing rail networks may require A$2–5 billion-plus in greenfield infrastructure investment, dramatically impairing project economics. For copper and gold producers, proximity to grid power avoids A$20–50 million per year in higher diesel-generation opex. Remote assets — more than 200 km from sealed road, no grid power, no existing port — typically trade at a 15–25% discount to comparable infrastructure-adjacent assets.
Production Profile, Reserve Life and AISC
For producing mines, all-in sustaining cost (AISC) is the primary differentiator within a subsegment. First-quartile producers command meaningful premiums — Cadia's sub-US$800/oz AISC was a central component of Newcrest's A$27 billion acquisition value. Reserve grade and mine life are critical: 10-plus years is the preferred minimum, and 20-plus years commands a premium. For gold developers, scale matters — the A$5 billion valuation of De Grey (NST/De Grey) was predicated on Hemi's projected 530,000 oz/year production at low AISC. For mid-market gold operators in the A$50–500 million revenue range, operators running below-industry AISC with 5-plus years of reserve life at current production rates will consistently attract multiple buyers.
Backlog Quality and Contract Tenure (Mining Services)
For contract mining, drilling, and engineering services businesses, backlog size and quality are the dominant value determinants. Tier-1 miners as customers materially reduce credit risk; three-to-five year contracts command a premium over short-term work; and underground capability — especially in gold and lithium — carries a scarcity premium in the current labour-constrained environment. Perenti's A$6.5 billion work in hand is the reference benchmark for what a A$3.49 billion revenue contract miner looks like at a 3.6x EV/EBITDA multiple. Mid-market equivalents with strong backlog coverage (4–6x trailing revenue in work-in-hand) and established Tier-1 customer relationships will attract both strategic and PE buyer interest.
Offtake Agreements and Strategic Buyer Premium
Binding offtake agreements provide a meaningful valuation uplift, particularly for development-stage critical minerals projects. An offtake covering at least 50% of nameplate production from an investment-grade counterparty adds a 10–20% valuation premium, primarily by reducing project financing costs and accelerating FID timelines. Government-backed or strategic offtake — such as with the US Department of Defense, EU battery manufacturers, or Japanese trading houses — can add 20–40% premium by reflecting reduced commercialisation risk. The US EXIM Bank, Australian Export Finance Agency, and allied government financing vehicles now provide substantial capital to projects with demonstrated Western offtake, creating a financing channel unavailable to uncontracted projects. For Australian critical minerals processors eligible under the CMPTI, the 10% refundable tax offset from 2027 functions as a structural cash flow enhancement that must be reflected in buyer models.
Commodity Cycle Positioning
The single most important contextual factor in mining M&A valuation is where the underlying commodity sits in its price cycle. The 2025–2026 period illustrates this vividly: gold at all-time highs is generating extraordinary seller leverage in gold producer and developer transactions; lithium in a recovering downcycle is producing counter-cyclical acquisition opportunities for well-capitalised buyers; nickel in a structural trough is creating distressed assets at steep discounts from which recovery buyers will benefit; and copper's structural deficit is commanding record strategic premiums from global majors. Owners who understand the cycle position of their commodity — and time their exit accordingly — consistently achieve better outcomes than those who sell at cycle trough or defer to the point of capital distress.
Frequently Asked Questions
Is Australia's mining sector active for M&A in 2026?
Yes — the Australian materials and mining sector is experiencing one of its most active M&A periods since the 2010–2012 supercycle. The global mining industry recorded 180 transactions totalling US$89 billion in 2025 — its strongest year in over a decade. Australian assets featured prominently, with gold driving the majority of deal value (US$31 billion in precious metals M&A globally) and critical minerals attracting sovereign-backed capital through the US-Australia Critical Minerals Framework Agreement signed in October 2025. The sector accounts for approximately 70% of Australia's national export earnings and contributes 11–12% of GDP directly, with A$437.3 billion in total sector revenue in FY2024–25.
What valuation multiples do Australian mining businesses achieve?
Multiples vary significantly by subsegment and commodity cycle position. Gold producers (operating, mid-tier): 6–10x EV/EBITDA; EV/oz Reserve A$200–400/oz. Gold developers (advanced, Tier-1): EV/oz Resource A$50–150/oz typical; infrastructure-adjacent deals have reached A$290/oz (Northern Star/De Grey). Copper producers: 5–8x EV/EBITDA. Iron ore mid-tier: 4–6x EV/EBITDA. Met coal: 3.5–5.5x EV/EBITDA. Lithium (through-cycle): 6–12x EV/EBITDA; EV/t LCE A$30–80/t in current downcycle. Rare earths (Lynas benchmark): 40–45x EV/EBITDA. Contract mining services: 3.5–6x EV/EBITDA. Mining engineering/consulting: 7–12x EV/EBITDA.
Who is buying Australian mining businesses in 2026?
The buyer universe spans several distinct categories. Global mining majors (BHP, Rio Tinto, Newmont, Gold Fields) are acquiring mid-tier producers and advanced developers to replenish declining reserve bases. Australian mid-tier producers (Northern Star, Evolution, Ramelius, Westgold) are consolidating to achieve scale and index inclusion. Strategic offshore buyers — including Korean and Japanese battery manufacturers and trading houses (POSCO, Sumitomo) — are acquiring partial stakes in critical minerals operations to secure supply chains. Private equity firms are backing mining services roll-up strategies. Sovereign wealth funds from the Middle East and Asia are emerging as anchor investors in critical minerals projects. The US EXIM Bank and Export Finance Australia are co-financing projects through the bilateral Framework Agreement.
How does the CMPTI affect critical minerals project valuations?
The Critical Minerals Production Tax Incentive — law since February 2025 — provides a 10% refundable tax offset on eligible processing and refining expenditure for Australia's 31 critical minerals, available from 1 July 2027 to 30 June 2040 (up to 10 years per facility). For a processing facility incurring A$150 million of eligible expenditure annually, the benefit is A$15 million per year — with a 10-year NPV of approximately A$101 million at an 8% discount rate. This must be explicitly modelled in all M&A valuations for eligible critical minerals processors. For large facilities, the structural IRR improvement can be 2–5 percentage points, which is material to project financing and acquisition economics.
What are the most important value drivers for a mining or mining services business?
For mining operations: jurisdiction (Australia Tier-1 premium 20–30% over comparable offshore assets), AISC position (first-quartile producers command meaningful premium), reserve life (10-plus years preferred), infrastructure proximity (mill/port/grid access), exploration upside adjacent to existing operations, and commodity cycle positioning. For mining services businesses: backlog size and quality (Tier-1 miner customers; 3–5 year contract tenure), fleet condition and age (lower maintenance capex = higher value), workforce quality and underground capability (acutely scarce), and geographic diversification (reduces revenue concentration). For critical minerals assets: CMPTI eligibility, offtake agreements with Western strategic buyers, processing integration (resource-plus-processing commands premium over raw concentrate export), and government co-investment status.
What types of mining businesses can Morgan Business Sales advise on?
Morgan Business Sales advises owners across the full materials and mining sector value chain — including gold and base metal operations, lithium and critical minerals projects, metallurgical and thermal coal businesses, contract mining and drilling services companies, mining equipment suppliers, mineral processing and beneficiation facilities, mining engineering and environmental consultancies, and METS businesses. We work with owners of businesses generating from A$2 million revenue upwards considering a sale or succession transaction. Our team has deep sector knowledge and an active buyer network spanning domestic, regional, and international acquirers.
Considering a Sale or Equity Transaction?
Morgan Business Sales advises owners of mining operations, contract mining companies, drilling services businesses, mineral processing facilities, and mining engineering consultancies across Australia. Whether you are planning an exit in 12 months or just beginning to explore your options, we can provide a confidential assessment of your business's value in the current market and introduce you to the right buyers.
Book a Free ConsultationConfidential | No obligation | Australia-wide
Sources & References
All data, transaction details, and market figures cited in this report are drawn from the primary sources listed below. Links are provided for direct verification.
- IBISWorld — Mining Division B (Australia, FY2024–25): ibisworld.com/australia/industry/mining/55/
- IBISWorld — Gold Ore Mining (B0802): ibisworld.com/australia/industry/gold-ore-mining/
- IBISWorld — Copper Ore Mining (B0803): ibisworld.com/australia/industry/copper-ore-mining/
- IBISWorld — Mining Support Services (B1101): ibisworld.com/australia/industry/mining-support-services/86/
- Geoscience Australia — Australian Identified Mineral Resources 2025: ga.gov.au/aimr2025/introduction
- Jobs and Skills Australia — Mining Industry Profile (Feb 2026): jobsandskills.gov.au — Mining Profile
- Resources and Energy Quarterly — December 2025: industry.gov.au — REQ December 2025
- Minerals Council of Australia — Australian Mining Mapped 2025: minerals.org.au — Mining Mapped 2025
- S&P Global Market Intelligence — Mining M&A in 2025: S&P Global — Mining M&A 2025
- FactSet — Metals & Mining 2025 M&A and ECM Insights: FactSet — Metals & Mining 2025 M&A
- GT Law — 2024 Mining Year in Review & 2025 Outlook: GT Law — Mining Review 2024/2025
- Dentons Mining Law — Surge in 2024–2025 Mining Megadeals: Dentons — Mining Megadeals 2024–25
- RBA Bulletin — Global Energy Transition and Critical Minerals (Oct 2025): RBA Bulletin — Critical Minerals Oct 2025
- CSIS — US-Australia Critical Minerals Framework Agreement: CSIS — US-Australia Framework
- White House — US-Australia Critical Minerals Framework (Oct 2025): Whitehouse.gov — US-Australia Framework
- PwC Australia — CMPTI Now Law (Feb 2025): PwC — CMPTI Now Law
- World Gold Council — Gold Outlook 2026: World Gold Council — Gold Outlook 2026
- J.P. Morgan Global Research — Gold Price Forecasts: JPMorgan — Gold Prices
- Schroders — The Quiet Boom in Gold Equities (Sep 2025): Schroders — Gold Equities
- Newmont — Newcrest Acquisition Completion (Nov 2023): Newmont — Newcrest Acquisition
- Northern Star Resources — De Grey Acquisition Complete (May 2025): NST — De Grey Completion PDF
- Ramelius Resources — Spartan Transaction Implementation Deed (Mar 2025): Ramelius — Spartan TID PDF
- Gold Fields — Gold Road SID Announcement (May 2025): Gold Fields — Gold Road SID PDF
- BHP — OZ Minerals Acquisition Completion (May 2023): BHP — OZ Minerals Completion
- Whitehaven Coal — BMA Daunia & Blackwater Acquisition (Oct 2023): Whitehaven — BMA Acquisition
- Rio Tinto — Arcadium Lithium Acquisition Complete (Mar 2025): Rio Tinto — Arcadium Completion
- Pilbara Minerals — Latin Resources Acquisition Complete (Feb 2025): Pilbara Minerals — Latin Resources
- Perenti — DDH1 Acquisition SIA (Jun 2023): Perenti — DDH1 SIA PDF
- Glencore — CSA Mine Sale Completion (Jun 2023): Glencore — CSA Mine Sale
- Lynas Rare Earths — FY2025 Full Year Results: Lynas — FY2025 Results
- Perenti Global — Valuation Multiples (Multiples.vc, Jun 2026): Multiples.vc — Perenti
- Lynas Rare Earths — Valuation Multiples (Multiples.vc, Jun 2026): Multiples.vc — Lynas
- AZoMining — Key Themes Surrounding the Lithium Market in 2026: AZoMining — Lithium Market 2026
- East Asia Forum — Australia Gets Nickel and Dimed by Indonesian Downstreaming: East Asia Forum — Nickel & Indonesia
- Mining Technology — Australian Mining Industry 2025 Review: Mining Technology — 2025 Review
- NAIF — Critical Minerals Financing (2025): NAIF — Critical Minerals
- FirstPageSage — EBITDA Multiples for Engineering Companies 2025: FirstPageSage — Engineering Multiples
Disclaimer: This report is produced by Morgan Business Sales for informational purposes only and does not constitute financial product advice, investment advice, or a recommendation to buy or sell any asset. All transaction values and valuation multiples are indicative based on publicly available information and disclosed deal terms; individual business valuations will vary materially based on specific asset characteristics, timing, buyer competition, and negotiating dynamics. Commodity price forecasts are sourced from third-party analysts and are not guaranteed. Morgan Business Sales is a business brokerage advisory firm and does not hold an Australian Financial Services Licence (AFSL). Readers considering a sale, acquisition, or equity transaction should obtain independent financial, legal, and tax advice. All figures are in Australian dollars (AUD) unless stated as USD. AUD/USD rate used for conversions is approximately 0.71, reflecting the approximate rate in 2026 — a modest discount relative to parity. Data is current to June 2026 unless otherwise noted. © 2026 Morgan Business Sales. All rights reserved.